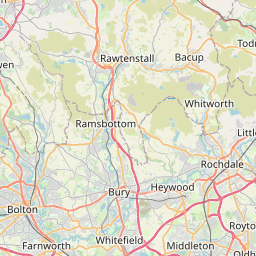
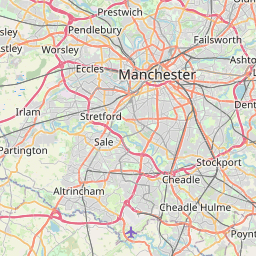
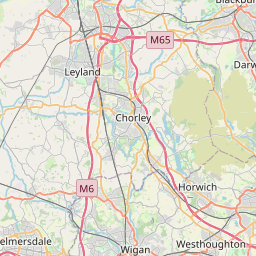
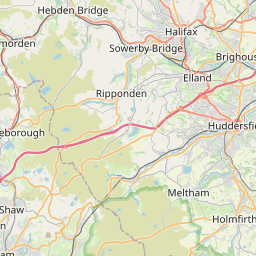
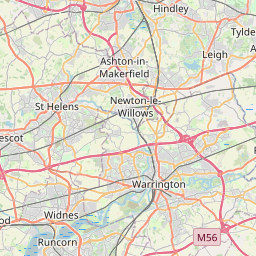
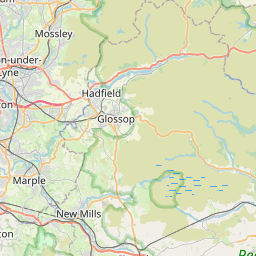
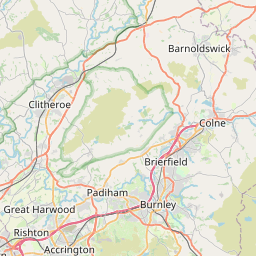
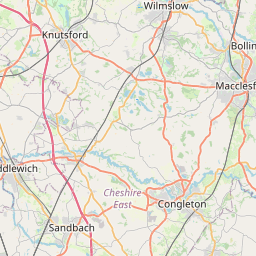


Growth trend in COVID19 cases in Manchester
As of 2020-10-01
The colors represent new cases in the past 2 weeks: Green means "no new cases", orange means "new cases either last week or this week" and red means "new cases both last week and this week"
Clicking on a LSOA will bring up the cumulative count, the number of new cases this week, and will show the curve of cumulative cases to date (each point represents a week)